Project
FPA-FOD Wildfire Ignitions
Oct 16, 2026
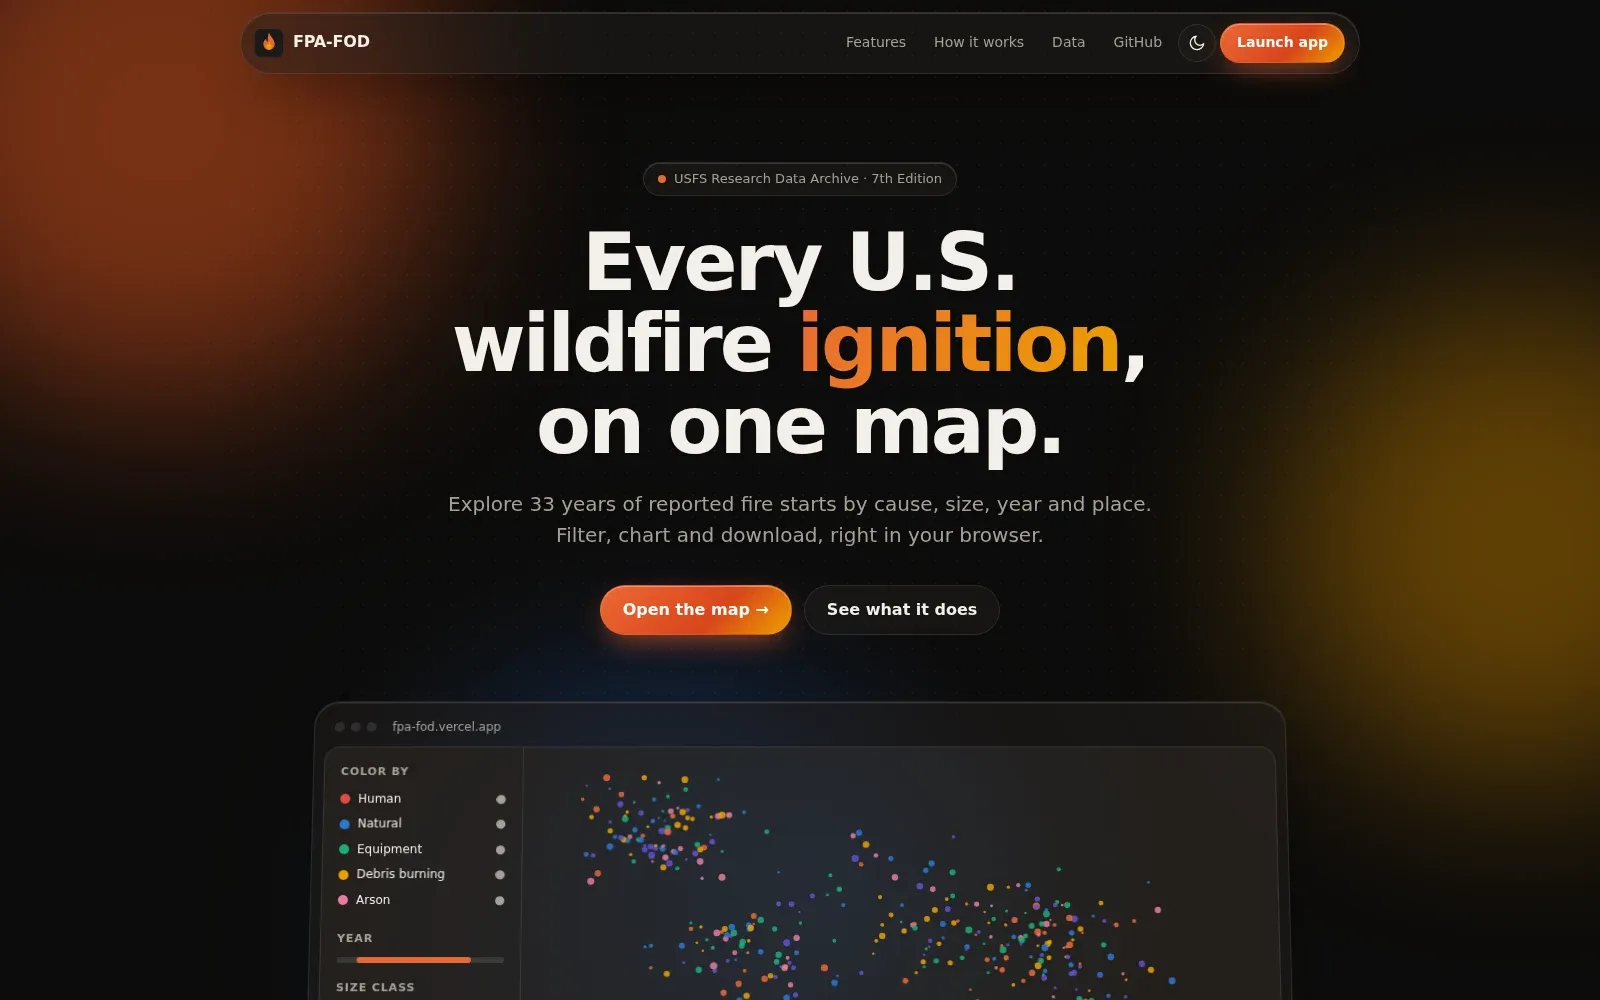
An interactive map of U.S. wildfire ignition points from the Forest Service’s Fire Program Analysis Fire-Occurrence Database (FPA-FOD), 1992 to 2024. You can color, filter, and chart fires by cause, year, size, owner, agency, and place.
It runs in the browser with MapLibre GL JS and a PMTiles file, with no backend. Views live in the URL so they can be shared, and DuckDB-WASM powers exact counts, charts, and CSV, GeoJSON, and Parquet exports that carry the dataset citation.
The data is the 7th edition of the FPA-FOD (Short, 2026), from the Forest Service Research Data Archive. Fires can be colored by cause, cause class, owner, reporting agency, size class, year, or month, and drawn as points or a heatmap. Filters cover year, season, state, county, acreage, owner, and agency, and you can draw an area (rectangle, polygon, or a 1 to 500 mile circle) or upload one as GeoJSON or a shapefile. Charts include fires per year by category, a month-by-category heatmap, and a year-by-year animation. A choropleth mode aggregates fires, acres, or fires per 1,000 km² by state, county, GACC, or EPA ecoregion.
Basemaps come from OpenFreeMap and USGS imagery, and the tiles are served from Cloudflare R2.
The same database can be downloaded in R with fireR.